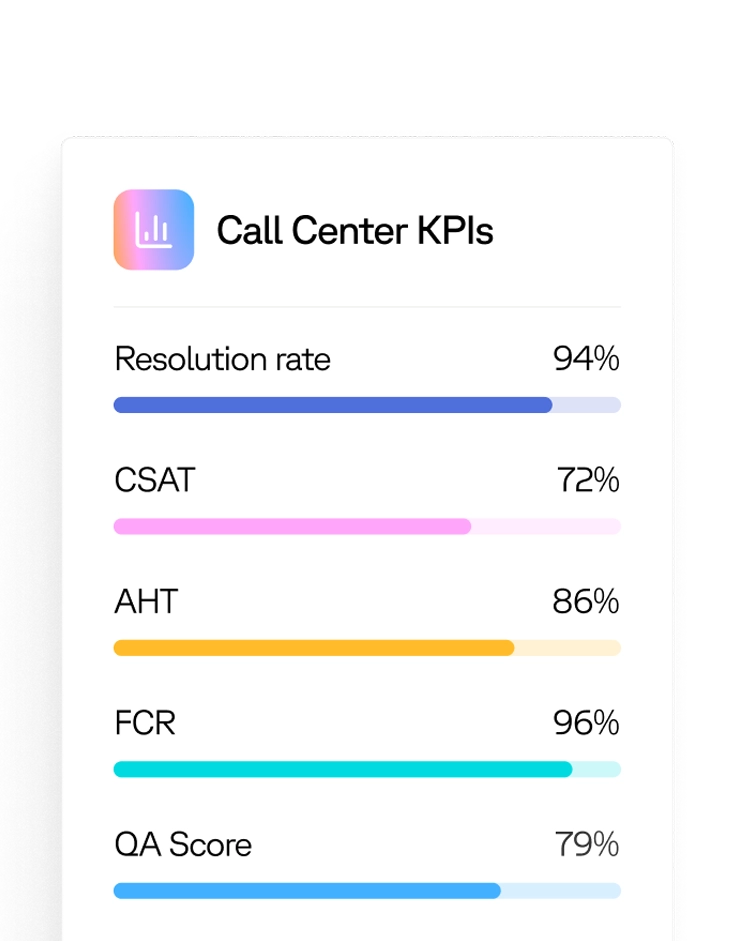
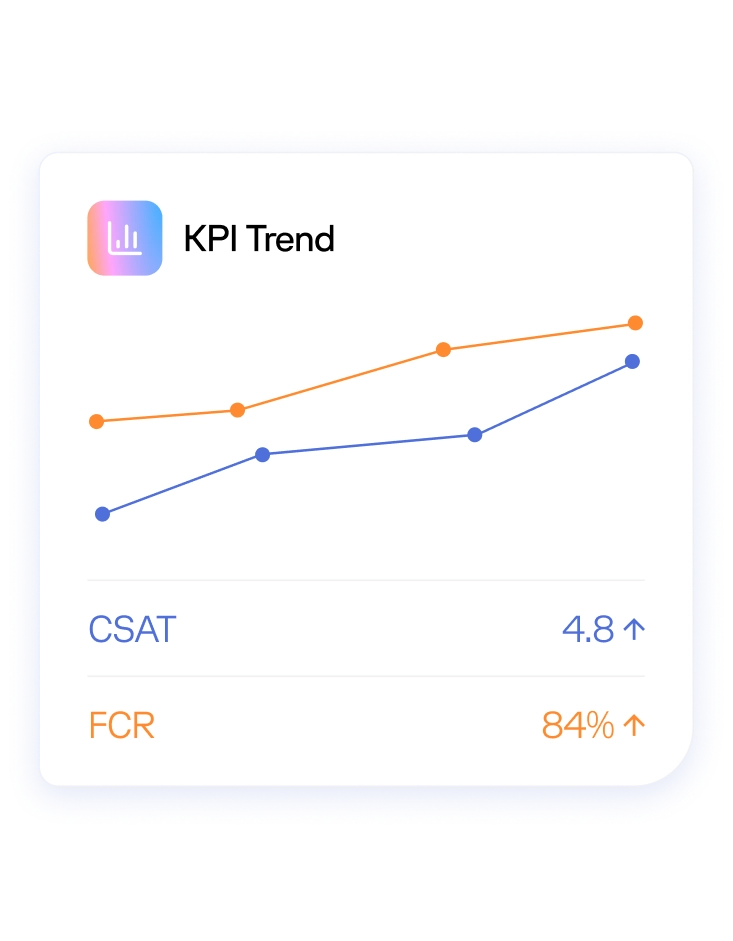
Reporting and Analytics
259Reporting and Analytics

Reporting and Analytics

We enable holistic data analysis across the entire contact center, ranging from customer journey to agent productivity, right up to your business-critical KPIs. All effectively visualised for assessment, easily and immediately.

Contact Center Analytics with Microsoft Power BI

b+s CCBI Analytics

b+s CCBI is a business intelligence solution based on Microsoft’s Power BI for Cisco Contact Center Enterprise (CCE), available on-premise, in the cloud or hybrid. Selected values interact across diagrams to show selected problem areas at a glance. Groupings of organizations, locations and languages become a breeze with Power BI.

b+s CCBI product documentation

Advantages of b+s CCBI

Holistically prepared service center data

Visualized and fast filtering

No additional server performance and storage required

Intuitive UI, comprehensibility and flexibility

Filigree measurement of smallest entities with all their global relationships

Shared use on various devices possible

Feature set

Operation Operation

Operation

  • Further data from any source and department can be integrated and operated by the customer or by Bucher + Suter in the CCBI data model.
  • b+s CCBI is available as a stand-alone solution or as an add…
Show more
Operation

Operation

  • Further data from any source and department can be integrated and operated by the customer or by Bucher + Suter in the CCBI data model.
  • b+s CCBI is available as a stand-alone solution or as an add-on to b+s Reporting (call-by-call database server). The cloud solution, Power BI Gateway is installed on a server with an internet connection and delivers the data from the customer’s b+s Reporting to the Power BI data model in the Microsoft Azure Cloud.
  • Depending on the customer’s Microsoft licensing, the update schedule is defined, and a dedicated cloud instance is used if necessary.
Control Control

Control

  • Focus checkbox for easy differentiation of service level relevant objects.
  • Freely definable short call threshold.
  • Skill group and precision queue consolidation.
  • Display of data availability across…
Show more
Control

Control

  • Focus checkbox for easy differentiation of service level relevant objects.
  • Freely definable short call threshold.
  • Skill group and precision queue consolidation.
  • Display of data availability across all data sources.
  • Organizational groupings (BU/OU) facilitate segmentation of rights.
  • Data-independent date and time calendar for selecting and displaying data.
  • Retention of all configured objects, even if they have been deleted in the CCE.
Analytics Analytics

Analytics

  • All common contact center KPIs.
  • Purpose-built interactions between all charts in report templates.
  • Language dimension allows analysis of demand and existing language skills.
  • Location parameters fo…
Show more
Analytics

Analytics

  • All common contact center KPIs.
  • Purpose-built interactions between all charts in report templates.
  • Language dimension allows analysis of demand and existing language skills.
  • Location parameters for agents allow geographic analysis.
  • Primary queue reporting.
  • Originator (ANI) dimension and filter also allow recaller reporting.
  • Service level scenarios in 10 steps from 10 seconds to 20 minutes.
  • Inclusion of agent and department utilization.
  • Evaluation of wrap-up classification across all tasks and direct calls
  • Transfer reporting to the origin and destination
  • Comparison of key KPIs to previous month, previous quarter and same period last year
Roles and permissions Roles and permissions

Roles and permissions

Data models and report templates are published in the customer’s workspace. User segmentation of the data is done in advance, based on predefined roles and “row level security”. Assigning roles…

Show more
Roles and permissions

Roles and permissions

Data models and report templates are published in the customer’s workspace. User segmentation of the data is done in advance, based on predefined roles and “row level security”. Assigning roles allows easy management of access rights for the different users within a workspace.

Demarcation and limitations Demarcation and limitations

Demarcation and limitations

Demarcations

The licensing of Power BI is the responsibility of the customer and not part of the solution. Capacities and limitations are largely dependent on this and can also be increased increme…

Show more
Demarcation and limitations

Demarcation and limitations

Demarcations

The licensing of Power BI is the responsibility of the customer and not part of the solution. Capacities and limitations are largely dependent on this and can also be increased incrementally. The responsibility for publishing the data in the Azure Cloud and managing the access rights for the users lies entirely with the customer. This also includes compliance with country-specific data protection regulations.

Limitations

In the b+s CCBI data model, not all data of the reporting database is available (redundancies as partly not useful). Which measures are included with which release can be found in the specification of the data model.

Data integrations

Data integrations

  • Contact center inbound across all channels
  • Agent State Duration
  • Agent Direct Calls
  • CCBI Filter & Dimensions

b+s CCBI Screenshots

Call Details
Longterm Overview
Agent Comparison
Contact Center
Agent State Time
Agent Performance
Agent Overview
Service Level Details
Overview
Abandoned Contacts
Originator (ANI)
Performance Grid
All Originators (ANI)
Bottom Agent View
Comparison
Top Agent View
Transfer Destinations
Transfer Sources
Wrapup Classification

Have all your reporting needs met!

b+s Reports for CUIC

This Cisco Unified Intelligence Center software add-on is an out-of-the-box solution providing supervisors with comprehensive, customizable, and easy-to-view historical and real-time reports.

Product documentation

Benefits on Reports for CUIC

Consolidate

Optimizing is impossible without accessible, relevant information. b+s Reports gathers & synthesizes every bit of necessary data and presents it so supervisors can act decisively.

Visualize

To be useful, information must be meaningfully organized. Reports for CUIC takes incredibly complex data and presents it in an easy-to-read visual format so the right move is obvious.

Optimize

Providing responsive and efficient services is made possible through contact center optimization. b+s Reports for CUIC is where the effort to ensure the very best service begins.

Out-of-the-box Drilldowns

Easy-to-access data analytics makes it possible to reveal trends and patterns otherwise invisible.

Advanced Filters

Filtering on any field makes examining company- and product-specific data a breeze.

Omnichannel Reports

Admins can simultaneously evaluate all interaction types to optimally allocate contact center resources.

Real-time Graphs

Provide configurable, at-a-glance operational insight for admins operating in unusual volume situations.

Data Export Interface

Export data to third-party systems—like CRMs—to enable unified, multi-system reporting within a single interface.

Online Template Help

Get easy-to-understand, online information about templates, equations, and more, on every
open file.

Get it up and running fast so your IT department can get to work

Rapid implementation

You know what’s worse than a software package that is difficult to use? One that’s hard to install & configure. CUIC can be complicated. We’ve taken out the guesswork with a software package that installs fast and simple.

Get it up and running fast so your IT department can get to work

Pre-configured? You bet!

You don’t need to be a CUIC expert

If you think you need to be an expert to use CUIC correctly, you’re probably right. Fortunately, we’ve created a product that gives you all the CUIC functionality without requiring you be a Cisco Jedi.

Pre-configured? You bet!

Basic reports

– Agent login / log-out
– Not ready reason code
– Team summary performance
– Performance measurement
– Real-time and intra-day for dashboards
– Call classification
– Call flow analysis
– Precision queue analysis
– Skill group/precision queue membership
– Administrative configuration

Call-by-call reports

– ECE data integration and reporting
– Performance measurement
– Recaller analysis
– Inbound call detail
– Direct call classification
– Search customer call detail
– Call details (contact summary detail, contact history detail, call type detail, agent direct call detail, outbound campaign detail)

Resources

Fact Sheets

Videos

  • Analytics with Microsoft Power BI CDX Day 2020

USA Switzerland Germany

Let’s talk!

Global 24x7 Customer Service

4600 S Syracuse St, 9th Floor Denver, CO 80237

Lindenpark, Lindenhofstrasse 1 CH-3048 Worblaufen / Bern

Stubenwald-Allee 19
D-64625 Bensheim