Getting data-driven insights into contact center performance
Trust what your instruments tell you, not your gut. Pilots learn this maxim early in their training. It’s not so different for leaders in the call center. You’re constantly responding to internal and external conditions. Some known, some unknown. Some planned for, some completely unexpected.
This is what makes call center reporting and analytics so critical to operations. How else can you stay on top of agent load, call volume, and handle times – not to mention product issues, organizational change, and market shifts?
What follows is a call center reporting deep-dive, including best practices for not only getting the numbers but interpreting what they mean to inform better decision making.

What is call center reporting?
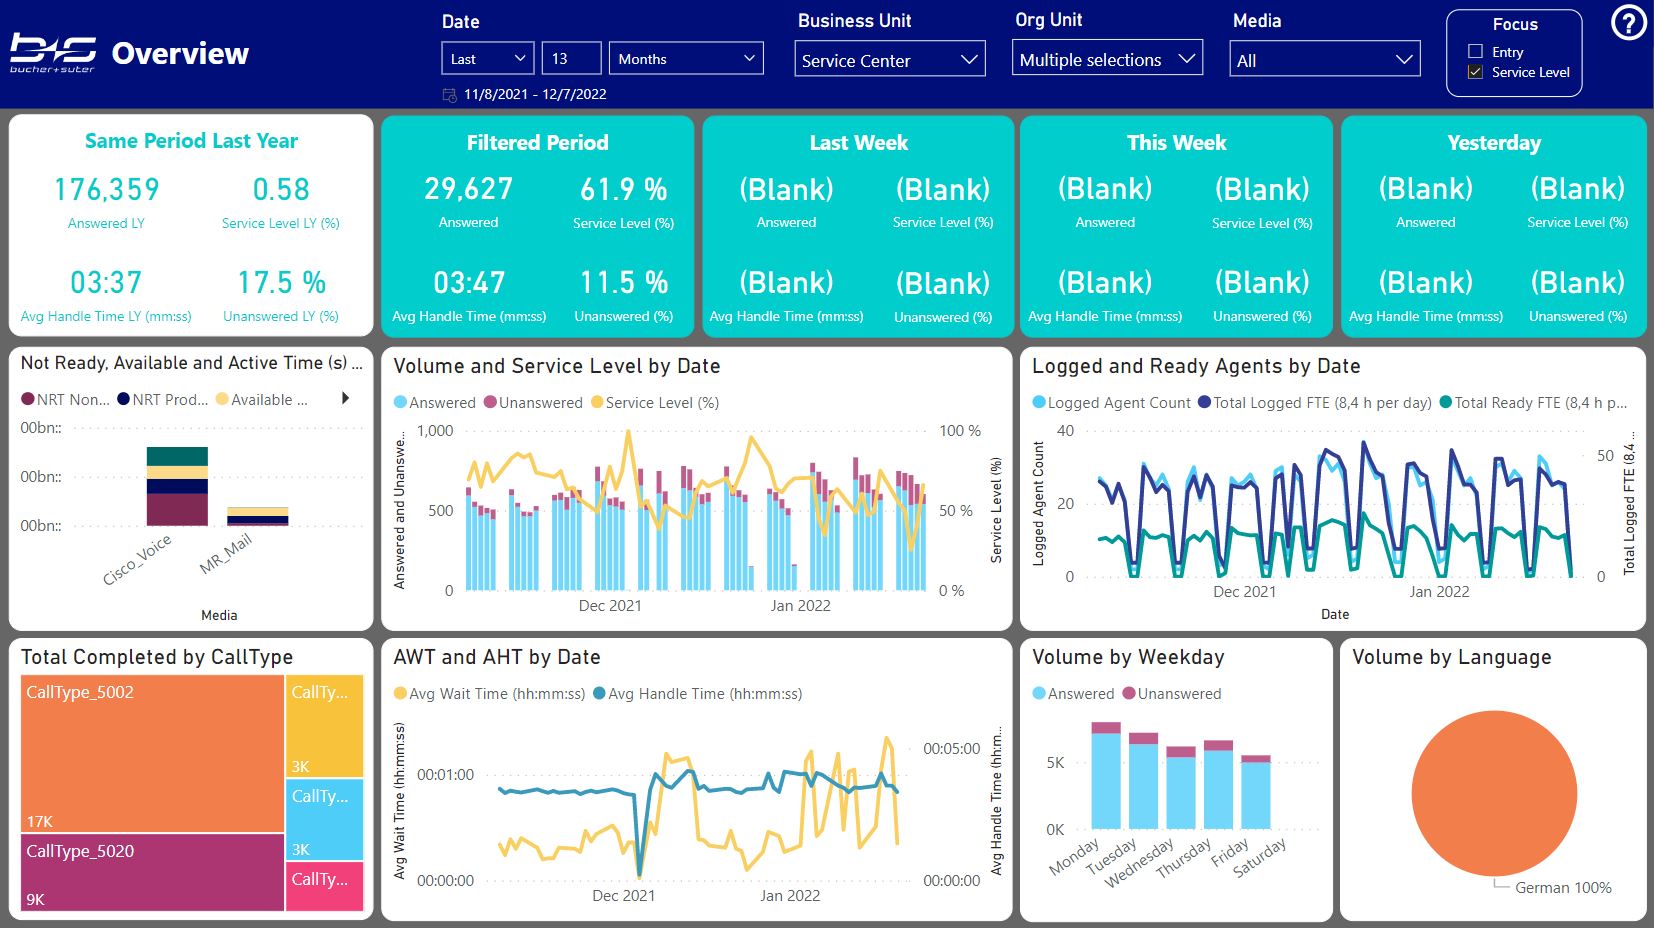
Call center reporting presents different data sources – such as average wait time, time to resolution, first call resolution, and NPS – into discernible forms. Usually, a manager or supervisor views various reports in a single dashboard, one that allows them to drill down into specific focus areas for more granular information.
Given the fast-changing challenges facing the call center, a reliable reporting dashboard is a must-have. For instance, this was supposed to be the year in which 63% of brands reduced wait times, and another 15% planned to increase the availability of live agents.
According to the same study, this is also the year that 92% of companies expected digital self-service engagement to increase, with only 39% anticipating an increase in phone communication. It’s difficult to demonstrate your progress toward these goals without sound reporting and analytics.
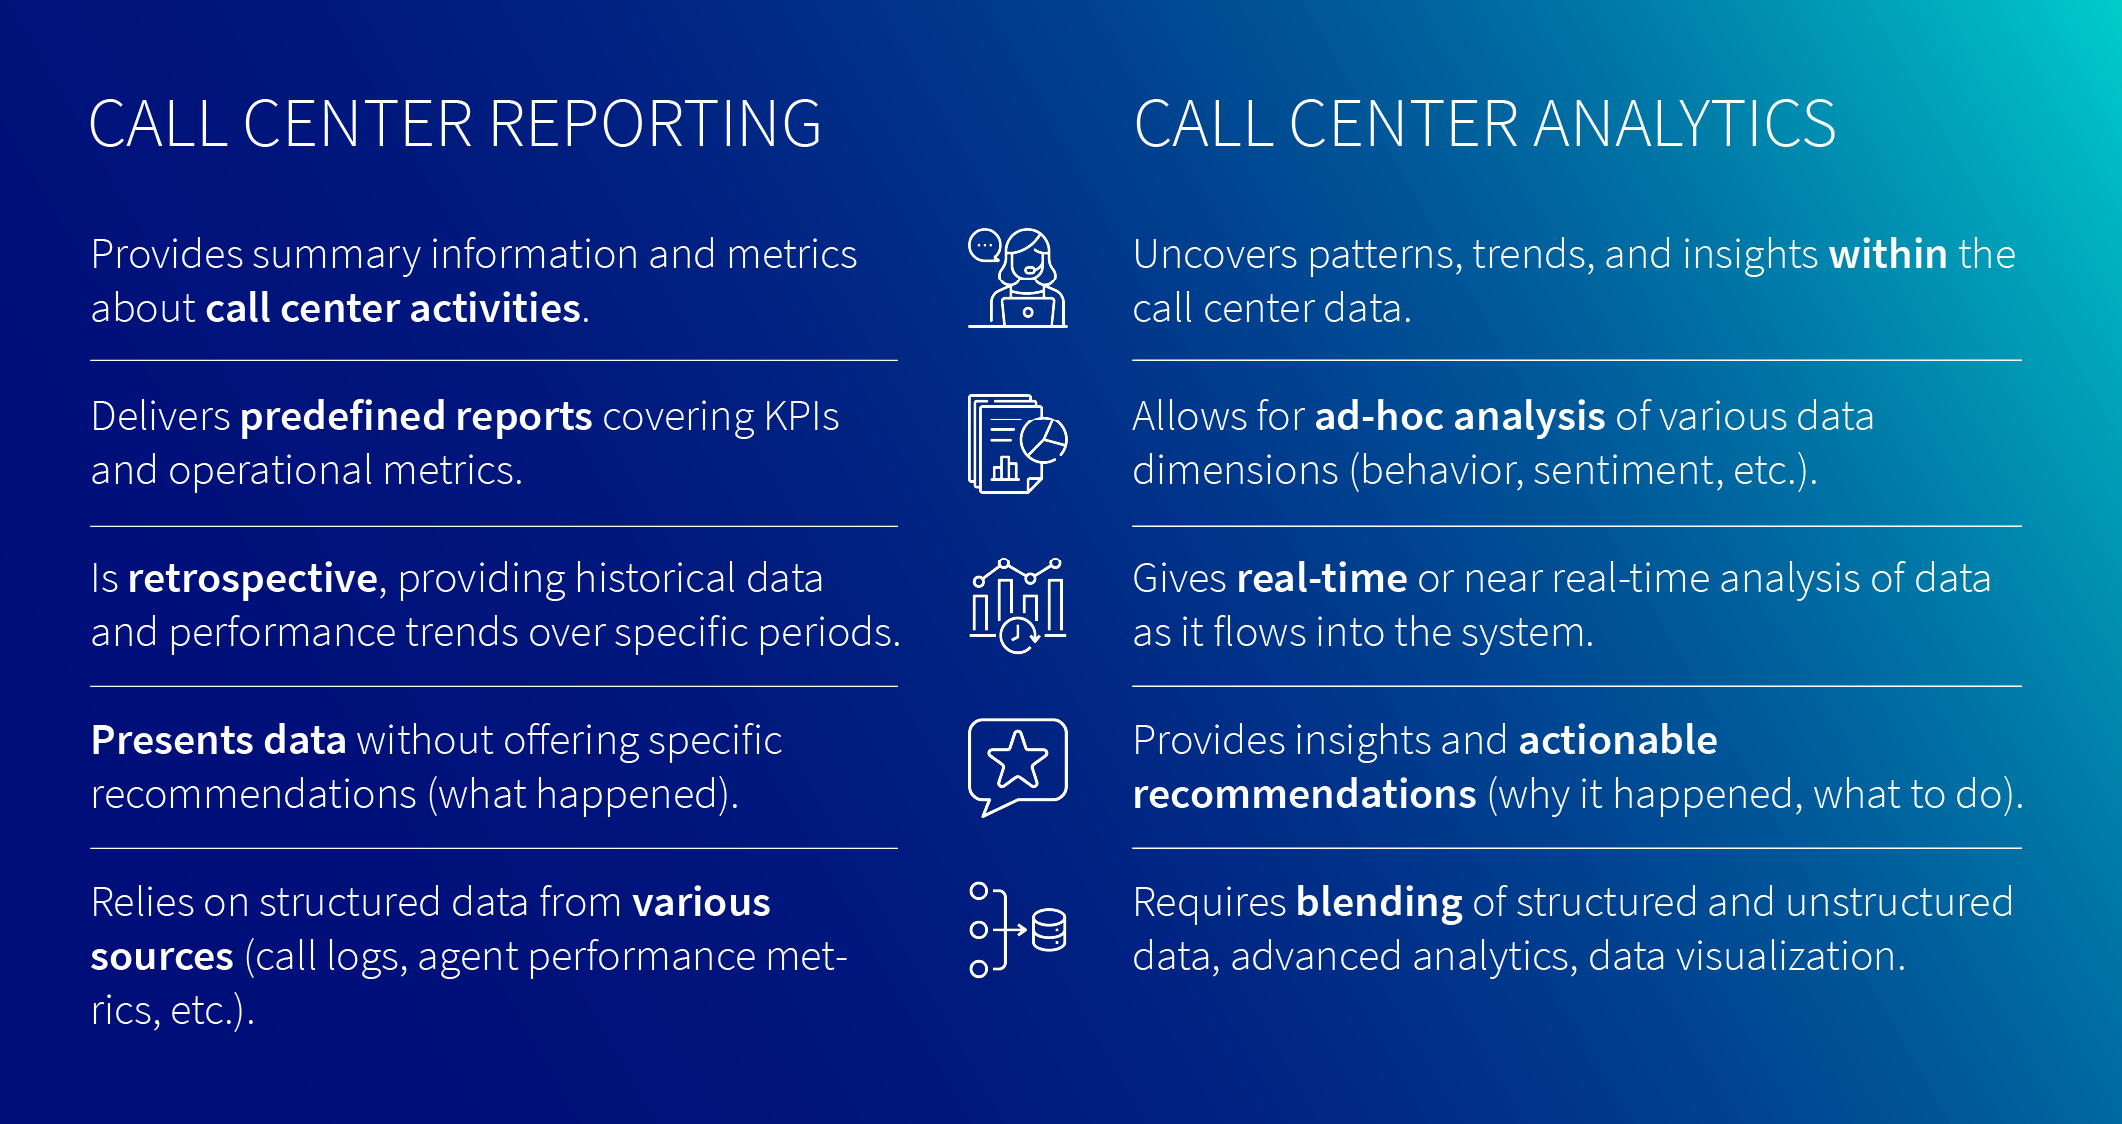
Call center reporting vs. call center analytics – what’s the difference?
If call center reporting is about the numbers and metrics you want to monitor, call center analytics is about what those numbers and metrics are telling you. For example, a call center metrics dashboard will alert you to a spike in cases related to uninstalling/reinstalling a software line; analytics will provide some insights into why that spike might be happening.
Key benefits of contact center reporting
Contact center reporting offers several benefits for leadership teams, individual employees, and customers. You’ll find that the right contact center reporting solutions support a number of important outcomes, namely:
More accurate performance analysis
Call center reporting provides detailed insights into the performance of your call center agents and overall contact center operations. Using call center metrics analytics and reporting, you can track your key metrics (detailed below) to identify areas of improvement for the team, measure individual agent productivity, and make informed decisions about team strategy and personnel.
Data-driven decision making
By analyzing call volume patterns, peak hours, and call types, for example, you can allocate resources more effectively, adjust staffing levels, and optimize agent scheduling. You can rely on call center reporting to find the trends, patterns, and customer preferences that are driving the customer experience.
Improved customer satisfaction
Monitor indicators of customer satisfaction, such as customer satisfaction scores (CSAT), wait times, and abandonment rates. By identifying bottlenecks and areas of concern, you can take proactive measures to reduce hold times, for instance, or improve call routing.
Real-time reporting also enables supervisors to intervene when necessary to resolve customer issues promptly. This is particularly useful at higher tiers of service that cater to higher-touch, higher-ticket customers (enterprise business support, for example).
Better performance management for agents
See agent availability and activity by group or individually. Spot top performers and those who need additional training or support. Use reporting to set performance targets, recognize achievements, and build targeted training coaching and training programs.
Cost optimization
See where operational costs can be reduced. For example, if you notice a high number of repetitive calls on a particular topic, you can develop self-service options or build tailored content journeys to help reduce that call volume. Many call center teams use reporting to help optimize staffing levels based on call volume patterns.
Career advancement and enablement
The Call Centre Management Association (CCMA) emphasizes how contact center data empowers individuals. With their own individualized dashboards, customer service agents can take the initiative in terms of self-monitoring and self-improvement. This not only creates a sense of ownership and motivation but takes extra work off the plate of already swamped managers.
In addition, the prevalence of contact center reporting and analytics has created new career paths for specialized analysts. These analysts can help contact center leadership extract conclusive narratives from the data – to demonstrate the call center’s contribution to cost reduction, for example, or customer lifetime value.
Identifying blindspots and breaking down silos
Blindspots and info silos come up all the time in the contact center. It’s not uncommon for team members to operate off of different numbers. Often, content gaps don’t reveal themselves until an issue arises. And even though we all want to create frictionless customer experience, understanding customer journeys still stands in the way for 47% of contact center leaders.
Common metrics and KPIs for call center reporting
Given these benefits, what numbers do you need to keep track of? You’ll find the following metrics on nearly any call center reporting dashboard, in one combination or another. These are commonly used to assess call center performance, monitor operational efficiency, and identify areas for improvement.
Average Handle Time (AHT)
The average time taken by agents to handle a customer call, including talk time, hold time, and any after-call work. A low AHT reflects efficient call handling and shorter customer wait times.
Time to resolution
The average time from first interaction to case resolution. This metric tells you how quickly agents are resolving cases. Do customers get their answers to email queries in hours? Days? What about chat and phone?
First Call Resolution (FCR)
FCR measures the percentage of customer issues or inquiries resolved during the initial contact with the call center. A high FCR indicates effective problem-solving and customer satisfaction, as it reduces the need for customers to call back or engage in multiple interactions.
Service level
Most contact centers have service level targets. For example, to answer 75% of calls within 60 seconds. Service level will indicate your call center’s ability to handle call volume and deliver acceptable response times.
Net Promoter Score (NPS)
NPS is an indicator of brand loyalty and satisfaction. Typically, you’ll ask customers to answer this question after an interaction: “How likely are you to recommend us on a scale of 1-10?” NPS is a composite of all those responses, with strong scores varying from industry to industry. For example, T-Mobile’s NPS score is 82 (quite strong).
Customer Satisfaction (CSAT)
CSAT measures the level of satisfaction or dissatisfaction experienced by customers after interacting with the call center. It is typically assessed through post-call surveys or customer feedback. A higher CSAT score indicates positive customer experiences and successful call center interactions. This is widely considered one of the most important contact center metrics.
Agent occupancy
Agent occupancy measures the percentage of time that call center agents are actively engaged in handling calls or other productive activities compared to their available work time. It takes into account factors like talk time, after-call work, and any idle or non-productive time. A higher agent occupancy suggests efficient utilization of resources and productivity.
Abandon Rate/Drop-off Rate
This is another important metric in the call center, as it’s a direct indicator of CX (if the rate is high, for example, what’s driving customers to give up on their query?). Most call centers establish baselines for abandon rate that they expect the group and individuals to meet.
How do you build your approach to contact center reporting?
The golden rule is to start with the customer experience, then build around it. The goal of contact center reporting is to make your team as productive and efficient as possible – in service of the customer. Keep that in mind when building your own reporting suite.
Follow these 5 call center reporting best practices
1. Define your Key Performance Indicators (KPIs)
The common KPIs we mentioned above don’t apply to every contact center. Determine the most relevant metrics for your call center’s success based on industry, business objectives, and other variables. For example, some contact centers supporting complex products might rely less on time to resolution as a reflection of customer experience.
2. Use real-time reporting
Implement real-time reporting tools to monitor call center performance as it happens. Real-time reports help supervisors identify trends, address issues promptly, and make informed decisions on staffing, training, or process adjustments in the moment.
3. Customize your reports for different stakeholders
Tailor reports to meet the specific needs of different stakeholders, such as managers, team leaders, or executives. Each group may require different metrics or levels of detail. Most groups prefer their reports in easy-to-consume, easy-to-share formats.
4. Analyze historical data
Explore historical call center data to identify patterns, trends, and areas for improvement. Historical analysis helps you identify recurring issues, case bottlenecks, and other opportunities for efficiency gains. For example, you might find that certain case spikes correspond with your product release schedule or a specific product update.
5. Visualize data effectively
Most call center employees engage with some form of call center metrics dashboard or agent performance dashboard on a daily basis. How you present call center metrics matters. Visual representations of data make it easier to understand trends, spot anomalies, and communicate insights effectively across the organization.
Choose the right contact center reporting solutions
All of this – the KPIs, best practices, etc. – relies heavily on your contact center reporting solutions. Three categories come to mind, for which B+S offers a number of specific solutions.
Business Intelligence (BI) and analytics platforms
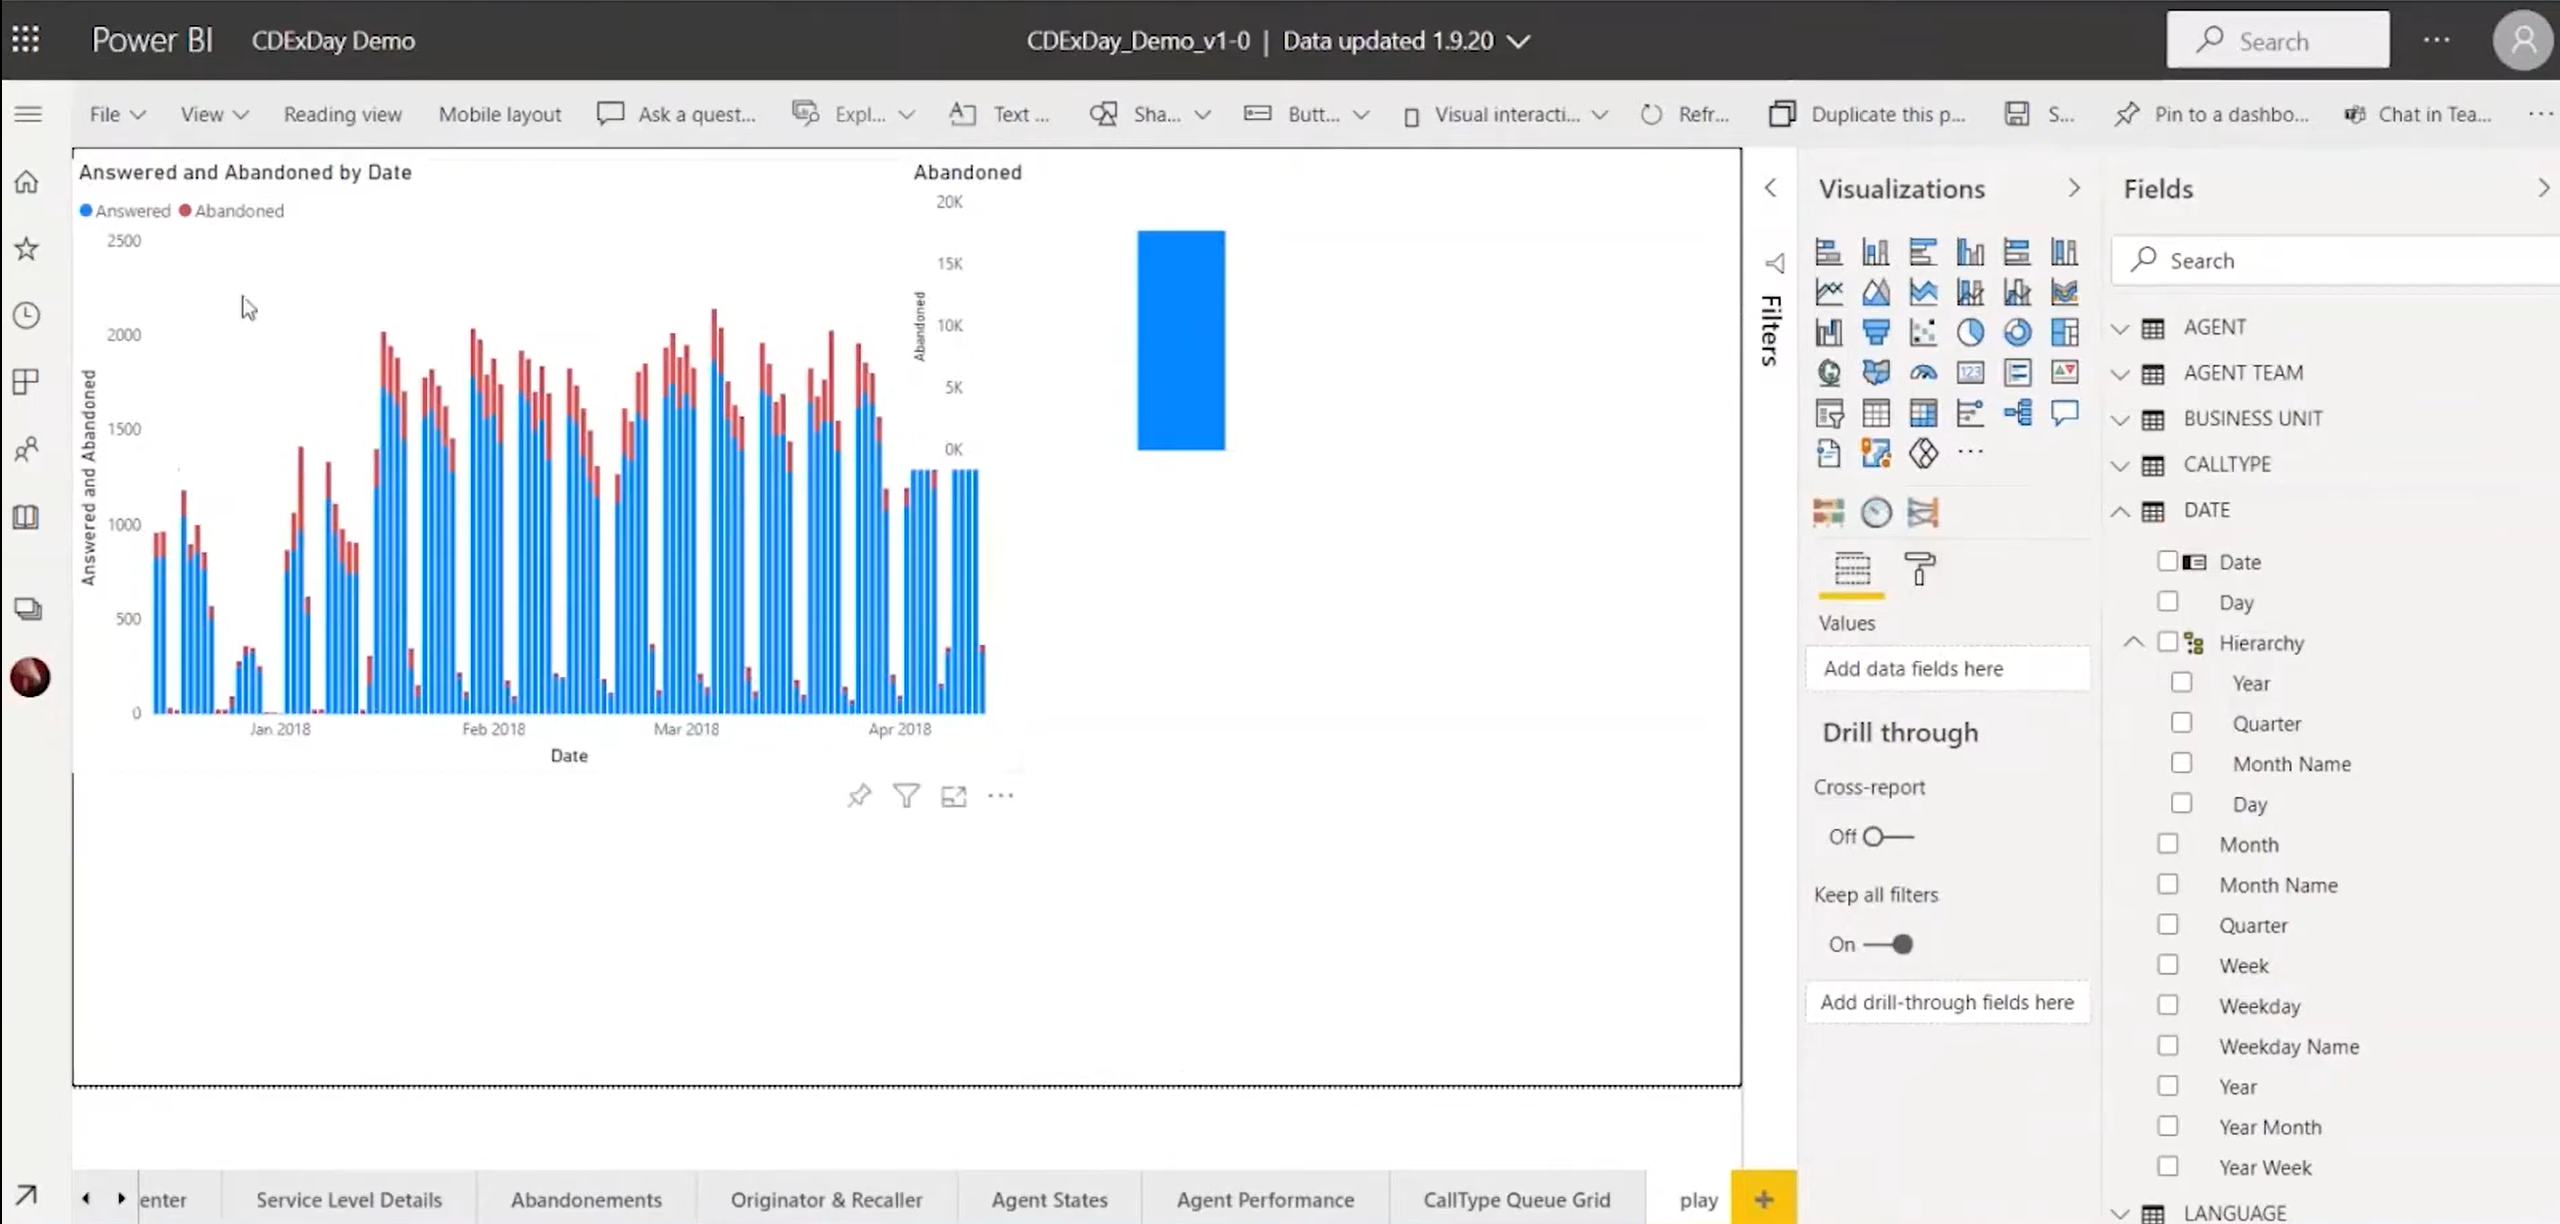
BI and analytics platforms provide advanced capabilities for analyzing call center data beyond basic reporting. These platforms utilize data visualization techniques, advanced analytics algorithms, and interactive dashboards to derive insights from call center data. These platforms can also enable predictive modeling and forecasting techniques to anticipate call volumes, agent performance, or customer behavior.
b+s CCBI is a business intelligence solution using Microsoft PowerBI and Cisco’s call data. It gives admins and contact center decision-makers the ability to hone and tweak their call center operations and make real-time and long-term strategic decisions that will help them save money.
Data integration and management tools
Effective call center reporting requires the integration of data from various sources, such as call logs, customer relationship management (CRM) systems, workforce management software, and quality monitoring tools.
Data integration and management tools facilitate the collection, consolidation, and transformation of data from multiple systems into a unified format for reporting purposes. These tools may employ data extraction, transformation, and loading (ETL) processes to ensure data accuracy and reliability.
Call center reporting software
Call center reporting software is specifically designed to collect, analyze, and present call center data in a structured and accessible format. These software solutions often provide pre-built report templates and dashboards that display key metrics and performance indicators.
They enable call center managers to generate reports on various aspects such as call volumes, agent performance, service level, and customer satisfaction. The software may also offer customization options to create ad-hoc reports and drill down into specific data points.
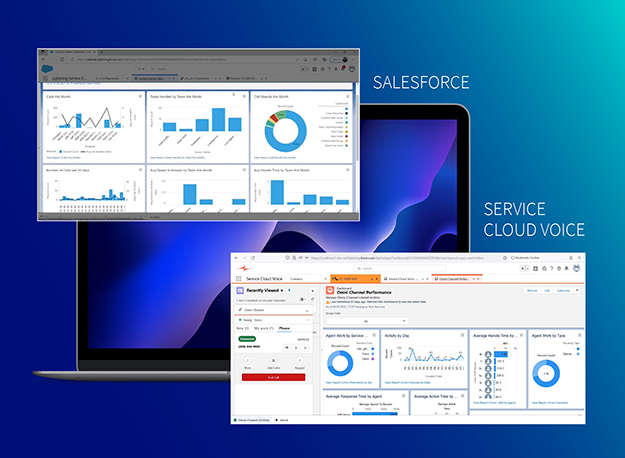
Bucher + Suter offers two solutions that bring data into Salesforce’s intelligent reporting solutions so that customers can derive actionable insights from their data in real-time. b+s Connects for Salesforce offers (among other things) real-time supervisor reports, keeping everything inside Salesforce where customer data is. b+s Connects for Service Cloud Voice features native voice objects, which enables voice and IVR reporting in a holistic way together, with other channels, in a single platform.
Toward more effective call center reporting strategies
Managing your call center strategy is not the same as flying an airplane. But in both contexts, it all comes down to people. Even if the plane is on autopilot, you need pilots to manage the flight and intervene where necessary.
Likewise, even a completely automated contact center will still serve people – your customers, partners, and employees. And you’ll still need contact center reporting and analytics to monitor and improve the experience for those people.
If you’re like most contact centers, your operation still relies on a lot of internal people to get the job done, people who also benefit from integrated and intuitive reporting. Either way, measure everything, trust your instrumentation, and always make decisions based on the data.
If you’d like to learn more about Bucher + Suter’s answer to call center reporting and analytics, please contact us using the form below.